← the tour · concept xiv–xv
concept xiv
The dev loop catches your mistakes
Dev mode turns whole classes of bug into a loud, located error instead of a silent wrong render. The guards are built; the debug panel is next.
The one loop is easy to reason about — one source of truth, one render path, one SSE channel. But "easy to reason about" doesn't mean bugs are impossible. A view that reaches outside its model, a handler that throws, a synchronous stall that nobody noticed: each of these produces a wrong screen and leaves no trace. Dev mode exists to intercept that class of failure at the source — before it ships — and name exactly what went wrong.
The design principle: silence is the enemy. A silent wrong render is worse than a loud crash — it ships, it misleads, and it's invisible in the logs. Dev mode trades silence for noise you can act on.
The region oracle built
region() is orion's model-aware live view — it skips a repaint when the
serialized model is unchanged for this viewer, so renders only run when data actually
changed. That optimization rests on a claim: the view is a pure function of its model.
A view that secretly reads data the model doesn't capture looks fine in testing, then goes
silently stale in production the moment that hidden data changes without the model noticing.
In dev mode the gameloop itself is the oracle. Every time the model says "nothing changed, skip this viewer," the view runs anyway and its output is compared against what was last sent. A mismatch means the claim is false — the view depends on something invisible to the model. Instead of a stale screen, you get:
// belt/region.ts — the oracle fires on a model-stable skip
if (ctx.dev) {
  const fresh = await view(model, ctx)
  if (String(fresh) !== lastOutput.get(ctx)) {
    throw new Error(
      "region contract violation: the model is unchanged but the view "
      + "produced different HTML — the view reads data that isn't in the "
      + "model, so dirty-checking can't see it changing. Move that data "
      + "into model()."
    )
  }
}
The error message is the fix. Dev verifies; prod trusts. The same oracle runs on
shared: true regions — two renders of the same model must produce identical
HTML for every viewer, or a viewer's private state is leaking into a shared cache it
shouldn't touch.
Error overlay built
A throw in any handler — a command, a live render, a fragment fetch — lands differently in dev versus prod. The split is deliberate and binary:
A located error surface
For Datastar actions (the datastar-request header is present), the error
is patched as an SSE overlay appended to body — it appears on the live
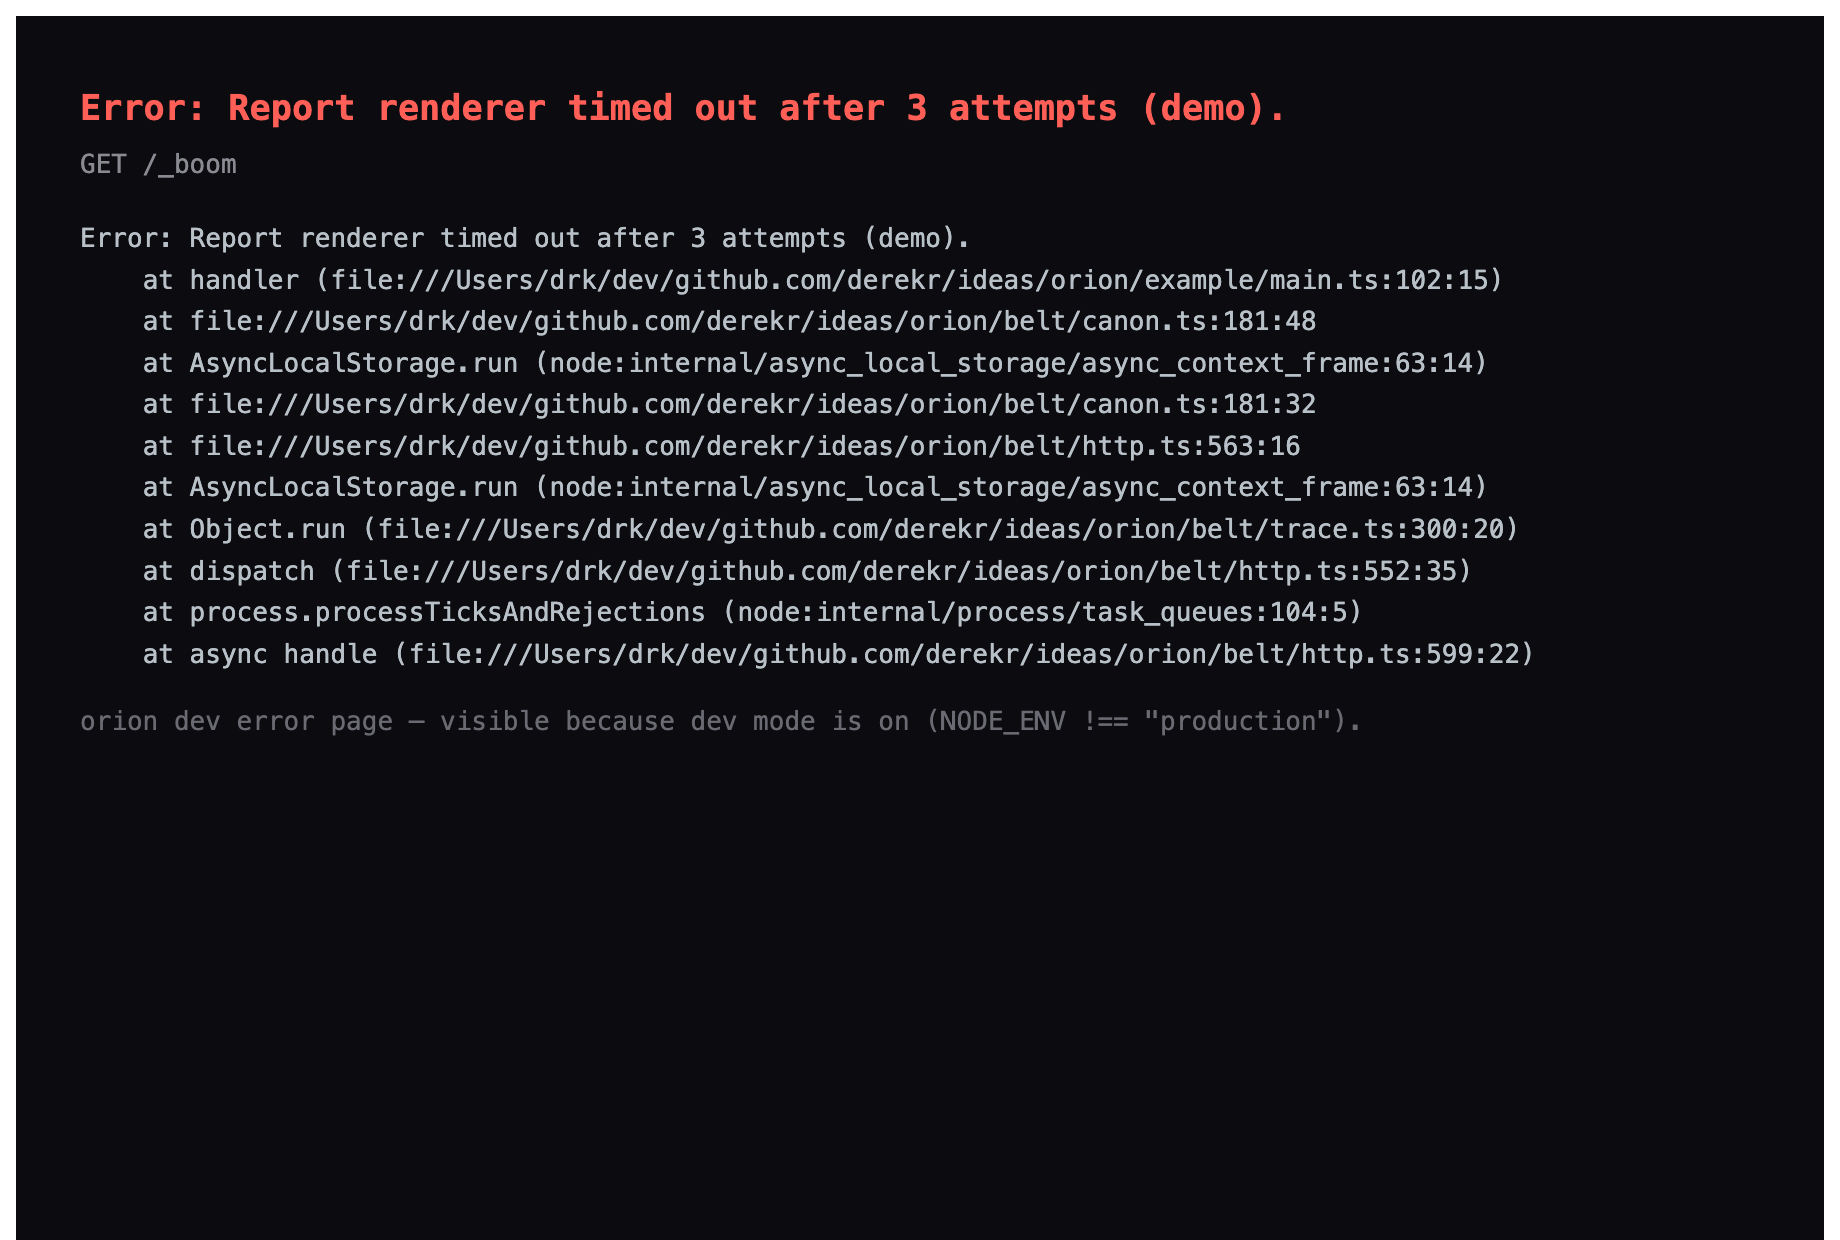
page without a reload, stack trace included. For plain page loads, a full error document
with the route and the stack. A throwing live render doesn't kill the stream; it overlays,
and the next event tries again with fresh state.
An opaque 500
The handler returns Internal Server Error with status 500. The stack goes
to the log, never to the browser. Nothing leaks — not the route shape, not internal
types, not dependency versions. The log line is the signal; the response is the wall.
// belt/http.ts — the unhandled-error branch inside createRouter()
if (dev) {
  if (request.headers.get("datastar-request")) {
    // Datastar action: SSE overlay patched onto the live page
    return sseResponse(request, (stream) => {
      stream.patch(errorOverlay(err, { route: routeLabel }), {
        selector: "body", mode: "append"
      })
      stream.close()
    })
  }
  if (request.method === "GET") {
    // Page load: full error document, stack visible
    return new Response(String(errorPage(err, { route: routeLabel })), {
      status: 500,
      headers: { "content-type": "text/html; charset=utf-8" }
    })
  }
}
return new Response("Internal Server Error", { status: 500 })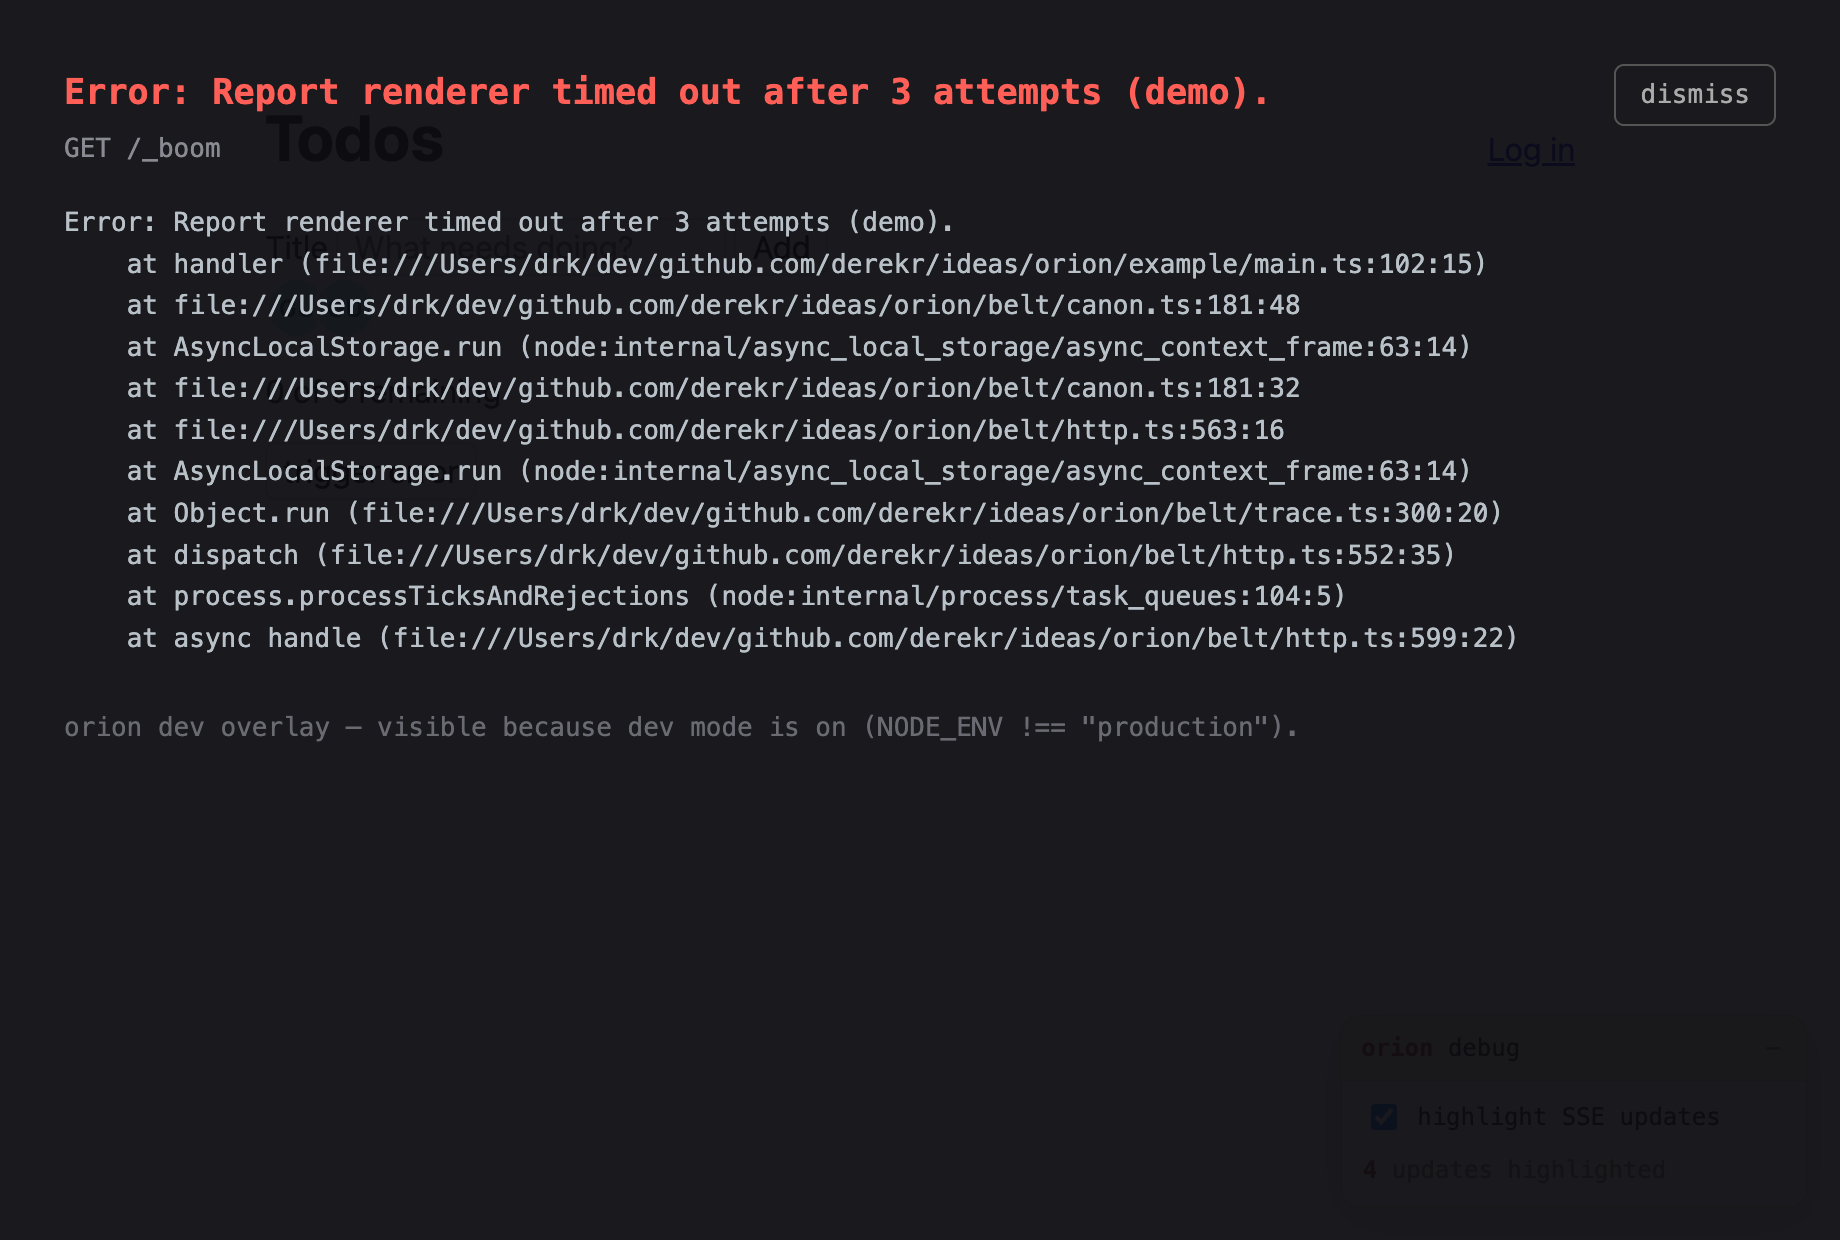
Stall attribution built
The one loop is synchronous on the render path — views call
todos.all(store) with no await. That's the design. But it also
means a CPU-heavy handler stalls the event loop for every other request and every live
repaint, silently. The symptom is "the app feels slow sometimes," pointing nowhere.
belt/health.ts makes it a number: perf_hooks.monitorEventLoopDelay
samples p50/p99/max lag on a per-second window, alongside event-loop utilization and open
stream count. When p99 stays above the threshold for two consecutive samples, it logs a
warning and — in dev — broadcasts a dismissible banner onto every open Datastar SSE stream
immediately. One warning per stall episode; it re-arms only after lag drops back under.
The attribution step makes the warning useful rather than alarming. A stall is a time
window. The trace buffer already holds hrtime-stamped spans for every request and paint in
the process — so belt/stalls.ts compares each span's time range against the
stall window and qualifies any span covering at least half the lag as a suspect. GC pauses
get their own pseudo-suspect ((garbage collection)) so an innocent route isn't
framed because it happened to be in flight during a collection. Stalls with no qualifying
span land in (unattributed), which is the data telling you to add spans around
the work you suspect — better than a tally that lies.
// belt/health.ts — stall detected, suspects named, dev banner broadcast
const stall = { detectedAtMs: Date.now(), lagMs: next.lag.max }
const suspects = attributeStall(stall, traceBuffer.recent(), gc.recent())
tally.record(stall, suspects)
const likely = suspects[0].name === UNATTRIBUTED ? undefined : suspects[0].name
log?.warn("event loop stalled", { p99Ms: ms, likely: likely ?? UNATTRIBUTED })
if (dev) broadcastPatch(healthWarning(ms, likely), { selector: "body", mode: "append" })
The tally is Watchable, so the admin dashboard's stall panel repaints live when an attribution lands. Worst offenders surface first; recurring suspects rise above one-off bystanders across repeated stalls.
Read-only masquerade lockout built
Support agents sometimes need to look at a customer's account as that customer — to reproduce a bug, diagnose a complaint. That's masquerade. But a support agent looking should not be able to accidentally write. The guard is explicit and greppable, not buried middleware:
// auth.guard.ts — isReadOnlyMasquerade() is the test; commands call it themselves
import { command } from "../../belt/http.ts"
import { toast } from "../patterns/toast.ts"

export function isReadOnlyMasquerade(ctx: Ctx): boolean {
  return activeMasquerade(ctx)?.readOnly === true
}

// a mutating command — check at the top, before touching the store
export const add = command(async (ctx, respond) => {
  if (isReadOnlyMasquerade(ctx))
    return toast(respond, "Read-only session — writes are blocked", { tone: "warn" })
  // … rest of the command
})
The masquerade entry is an ephemeral store keyed by the actor's session id — bounded,
never persisted, gone on restart. A deploy ends every active impersonation; a stuck
masquerade can never outlive the process that started it. Audit attribution is separate:
journaled actions during a masquerade record "alice (as bob)", never bob
alone, so no action taken during impersonation can be misattributed to the target.
Live reload built
In dev mode, /_orion/dev is automatically mounted as an SSE endpoint. The
view() handler injects a small client snippet into every rendered page
before the closing </body> — the snippet connects to that stream and
triggers a reconnect on change. The reload is not a special mechanism: it calls the
same idempotent full-region render that heals a dropped SSE frame. Live reload and
live repaints are the same idea.
The next rung: a debug panel you can toggle built
The guards above fire when something is wrong. The debug panel is for when everything is working and you want to watch it — a toggleable in-page affordance that flips dev diagnostics on and off, no rebuild, no restart.
Its headline feature is a live-region highlighter. As SSE pushes land and fat-morph the DOM, the panel briefly outlines exactly which elements a push just changed and ticks a counter. You see the loop work — every command's ripple, every viewer's repaint, every region that woke on this event — turning the invisible morph into something you can watch and debug. Open two tabs and add a record in one; the highlighter in the other shows you which region lit up.
The implementation is a dev-only client snippet in belt/dev.ts, injected next
to the live-reload script when ctx.dev is on. It's a MutationObserver
watching content changes (childList + characterData, never attributes), so a
server-pushed morph flashes but a client-side data-show toggle or a draft being
typed does not — you see precisely what the stream changed. Idiomorph minimises its edits, so
a deduped repaint that changed nothing produces no flash. Off in prod; costs nothing deployed.
Built and dev-verified. The dev guards above and the highlighter are all live today — once you can see the loop, you stop guessing about what changed.