← the tour · concept
concept xvii – xix
Knowing what it's doing
Three wide-event streams — same shape, different contracts — and a live dashboard that surfaces them without a second system.
There are two distinct questions buried under the word "observability." One is operational: is the system healthy right now? The other is product: did this human activate, retain, convert? Most teams route both to an external platform and spend the rest of the sprint on the bill. orion's answer is more boring: it's the same SQLite you already run, a few append-only tables, and live views over the belt's own instruments. No second pipeline, nothing about your users leaving the box.
Three streams, one shape
orion keeps three record-keepers, and the most important thing about them is their contract — what kind of reader each one serves:
| Stream | Contract | The question it answers | Audience |
|---|---|---|---|
| journal | durable · transactional · by-subject | What happened to this entity, and when? | audit, business |
| analytics | best-effort · buffered · by-name | Did this event happen? How often, across whom? | product, growth |
| canon | per-request · by-trace | What exactly did this one request do? | operator, debugging |
All three are wide structured events. The journal is the transactional one — a fact that
commits inside the command's own store.tx(), so the audit record and the domain
change are either both there or neither is. Analytics is the lossy one — a buffered
track() that flushes one multi-row insert per tick, so capture never touches the
synchronous render loop. Canon is the operational one — one fat event per request, emitted
exactly once on the way out.
The test for which stream a fact belongs to: would a human, weeks later, ask this of a specific entity and expect a permanent answer? That's the journal. "What was the system doing during that incident?" — that's logs and traces. "How many users hit this step in the onboarding funnel?" — that's analytics.
Product analytics — a table and some group by planned
The honest answer to "which analytics tool" is: a table and some group by. It's
the same SQLite you already run. There's no Posthog bill, no second pipeline, and nothing about
your users leaving the box. The belt owns the sink — an append-only
_orion_events table and a buffered track(). Your feature owns
the questions — funnels and retention as plain SQL you can read, not a query
DSL you can't.
// capture — server-side by default: a command that succeeds IS the conversion
analytics.track("subscription_started", { plan }, { subject: user.id })

// ask — a funnel is a left join of "did the event happen, per subject"
const funnel = activationFunnel(store, 30)  // signup → activated → paid
subject is your opaque user id — never an IP, never a fingerprint;
props are a JSON blob you choose. First-party by construction. A live region over
those funnels repaints the activation board as events land — your dashboard, built from a
group by, costing one more SQLite read.
The data ladder: don't climb before you must planned
Just as deployment is a ladder you climb rung by rung, so is how a slice models truth. Most of an app never leaves the bottom; a rare slice climbs — and it climbs alone, because the table-ownership fence lets one feature be event-sourced while everything around it stays boring CRUD.
| Rung | Model | Where's the truth |
|---|---|---|
| 0 — state | tables only | current state; no history |
| 1 — journal | tables + append-only fact log, written inside the command's transaction | tables; events ride alongside as durable audit |
| 2 — analytics | tables + best-effort behavioral sink, off the loop | tables; events are a lossy aggregate stream |
| N — event sourcing | an event log; tables are a projection you fold | the events; state is the shadow |
Read the rightmost column. Rungs 0–2 keep tables as the truth and events as a
shadow; full event sourcing inverts it — events become the truth,
state a derived read model. That inversion pushes the source of truth
off the synchronous read path — the exact property the one loop (render reads SQLite
with no await) is built on. So the heuristic: climb a slice to full event sourcing
only when history is the asset, time-travel is a feature, or the domain is genuinely
transition-shaped. Otherwise stay down-ladder.
The analytics read engine is its own small ladder: SQLite group by
+ a rollup table, then an embedded DuckDB that queries the SQLite file directly, then DuckDB
over day-partitioned Parquet — swapped behind the funnel functions, never rewritten.
The canonical log line built
Most teams log naively — a scatter of narrow lines with no shared context, so "what happened to tenant X's request" means grepping six of them and joining by hand. The fix is the canonical log line (Stripe's move, what evlog productizes): accumulate one wide event per request and emit it once. orion is already set up for it — the router opens a root span per request, and a canonical line is that span's attribute bag as a log event.
// anywhere in the async chain — no ctx threading, like currentSpan()
canon({ rows_scanned: 42, cache: "miss" })

// one line lands on the way out — sliceable by tenant, plan, route, flag
{ "route":"POST /todos", "tenant_id":"acme", "plan":"pro", "user_id":"u_91",
  "status":200, "duration_ms":12.4, "flag.welcome":true, "trace_id":"…" }
The split is the usual one. Mechanism — the belt threads the lifecycle and
the structural fields it always knows (route, status,
duration_ms, outcome, trace_id), and never auto-captures
signal values. Policy — the app supplies enrichers that map its seams to
fields (tenant, plan, user, the flags actually evaluated this request). Because tenancy,
entitlements, and flags each go through one seam, that context attaches itself — which is
exactly what naive logging can't do.
add() vs tag() — the cardinality split
Wide events love high cardinality. You store one row per request and query it, so per-entity fields cost storage — not the combinatorial time-series explosion that kills a metrics label. The API encodes that directly:
add(fields)
The event bag. A user_id, a trace_id, a raw
ltv_cents — per-entity values belong here. This is the point of the whole
thing.
tag(fields)
Also on the event, but metric-safe. Dev lints a uuid or email that wanders in — it
guides, never blocks. ltv_band, plan, flag.welcome
all belong here.
Cardinality isn't volume. You control cost by sampling — keep every error and every
slow request, sample the boring 200s — never by dropping dimensions. The default sampler
does exactly this; keepRate is the dial.
Flag evaluations, auto-recorded
flagExposure is an onEvaluate hook for the flags seam. Wire it once
at flag construction and every flag a request checks self-records on that request's canonical
line — flag.welcome=true — with zero per-flag wiring. A flag name is a bounded
set and the result is boolean, so it's a tag() (metric-safe). It's a no-op outside
a request, because the ambient line simply isn't there:
import { createFlags } from "../../belt/flags.ts"

// wire once at boot — every evaluated flag stamps itself automatically
const flags = createFlags(store, { onEvaluate: flagExposure })
Tracing — OTel-shaped, zero-dep
Every request is automatically a root span. The router wraps handlers, honors incoming W3C
traceparent headers, and labels spans with the route. Features add their own via
ctx.trace.span() — parenting is automatic through AsyncLocalStorage,
so nested spans nest across awaits with no context-passing ceremony:
import { command } from "../../belt/http.ts"
import { parse } from "../../belt/shape.ts"

export const create = command(async (ctx, respond) => {
  const result = await ctx.trace.span("validate", () => parse(reportShape, ctx.signals))
  ctx.trace.span("enqueue build", { reportId: result.value.id }, () => {
    ctx.store.tx(() => { /* insert + enqueue */ })
  })
})
The shape is OTel — traceId, spanId, parentSpanId,
nanosecond timestamps, flat attributes, ok/error status — without the
OTel SDK. The SDK is a dependency; the shape is a convention. Anything downstream that speaks
OTLP ingests these spans with a dumb field mapping.
Links, not parents — causality across the bus
A live repaint isn't inside the command that woke it. One command's event fans out to N viewers, and a paint can't honestly be a child span of someone else's request. So orion uses the OTel convention for events: span links. The bus wrapper stamps the publishing span's context onto every event as a cause; reactions — paints, job runs — record it as a link. Related, not owned. The chain
POST /reports → job report.build → jobs.progress → paint GET /reports/liveis traversable end to end, and the Traces panel shows "⟶ caused by POST /reports"
on every reaction. Jobs carry the cause through durability, so the link survives a process
restart.
Where traces go: a ladder
- Blessed default: an in-process ring buffer — the last ~200 root traces,
process-local, lost on restart. That's deliberate. It's Watchable, so the Traces panel is
just another live region over
traces.subscribe(). - Production: an OTLP collector, as a recipe. Subscribe to
traces.onTrace(fn)and POST OTLP/HTTP JSON to your collector withfetch— zero-dep glue, your endpoint in your config. The belt never grows a vendor client.
The export path is already here: a canonical line is the trace's attribute bag
as a log event, so the onTrace→OTLP recipe ships it to
evlog or Honeycomb unchanged. The belt is the good-enough
embedded approximation; the seam to the real thing is wired.
The log ring — Watchable by construction
The structured logger is deliberately small: leveled JSON lines to stdout, child loggers for binding context. Pretty-printing is the dev CLI's job, not the logger's. But the logger taps a Watchable ring buffer by default — the same stance as the trace ring — so the admin Logs tab repaints as lines land with no extra wiring:
import { createLogBuffer } from "../../belt/log.ts"
import { live } from "../../belt/http.ts"

// belt/log.ts — every logger taps the global ring unless opted out
export const logs: LogBuffer = createLogBuffer()  // Watchable

// the admin Logs panel is just a live region (opts, then the view fn)
export const logsLive = live(
  { watch: [logs] },                   // repaints as lines land
  () => LogsPanel(logs.recent()),
)
Every request-scoped log line carries the request's traceId — bound by the router
into ctx.log at the one place the root span and the child logger both exist. Grep a
slow trace's id from the Traces panel and the request's log lines fall out; spot a weird log
line and its waterfall is one lookup away. Logs and traces are joined by construction.
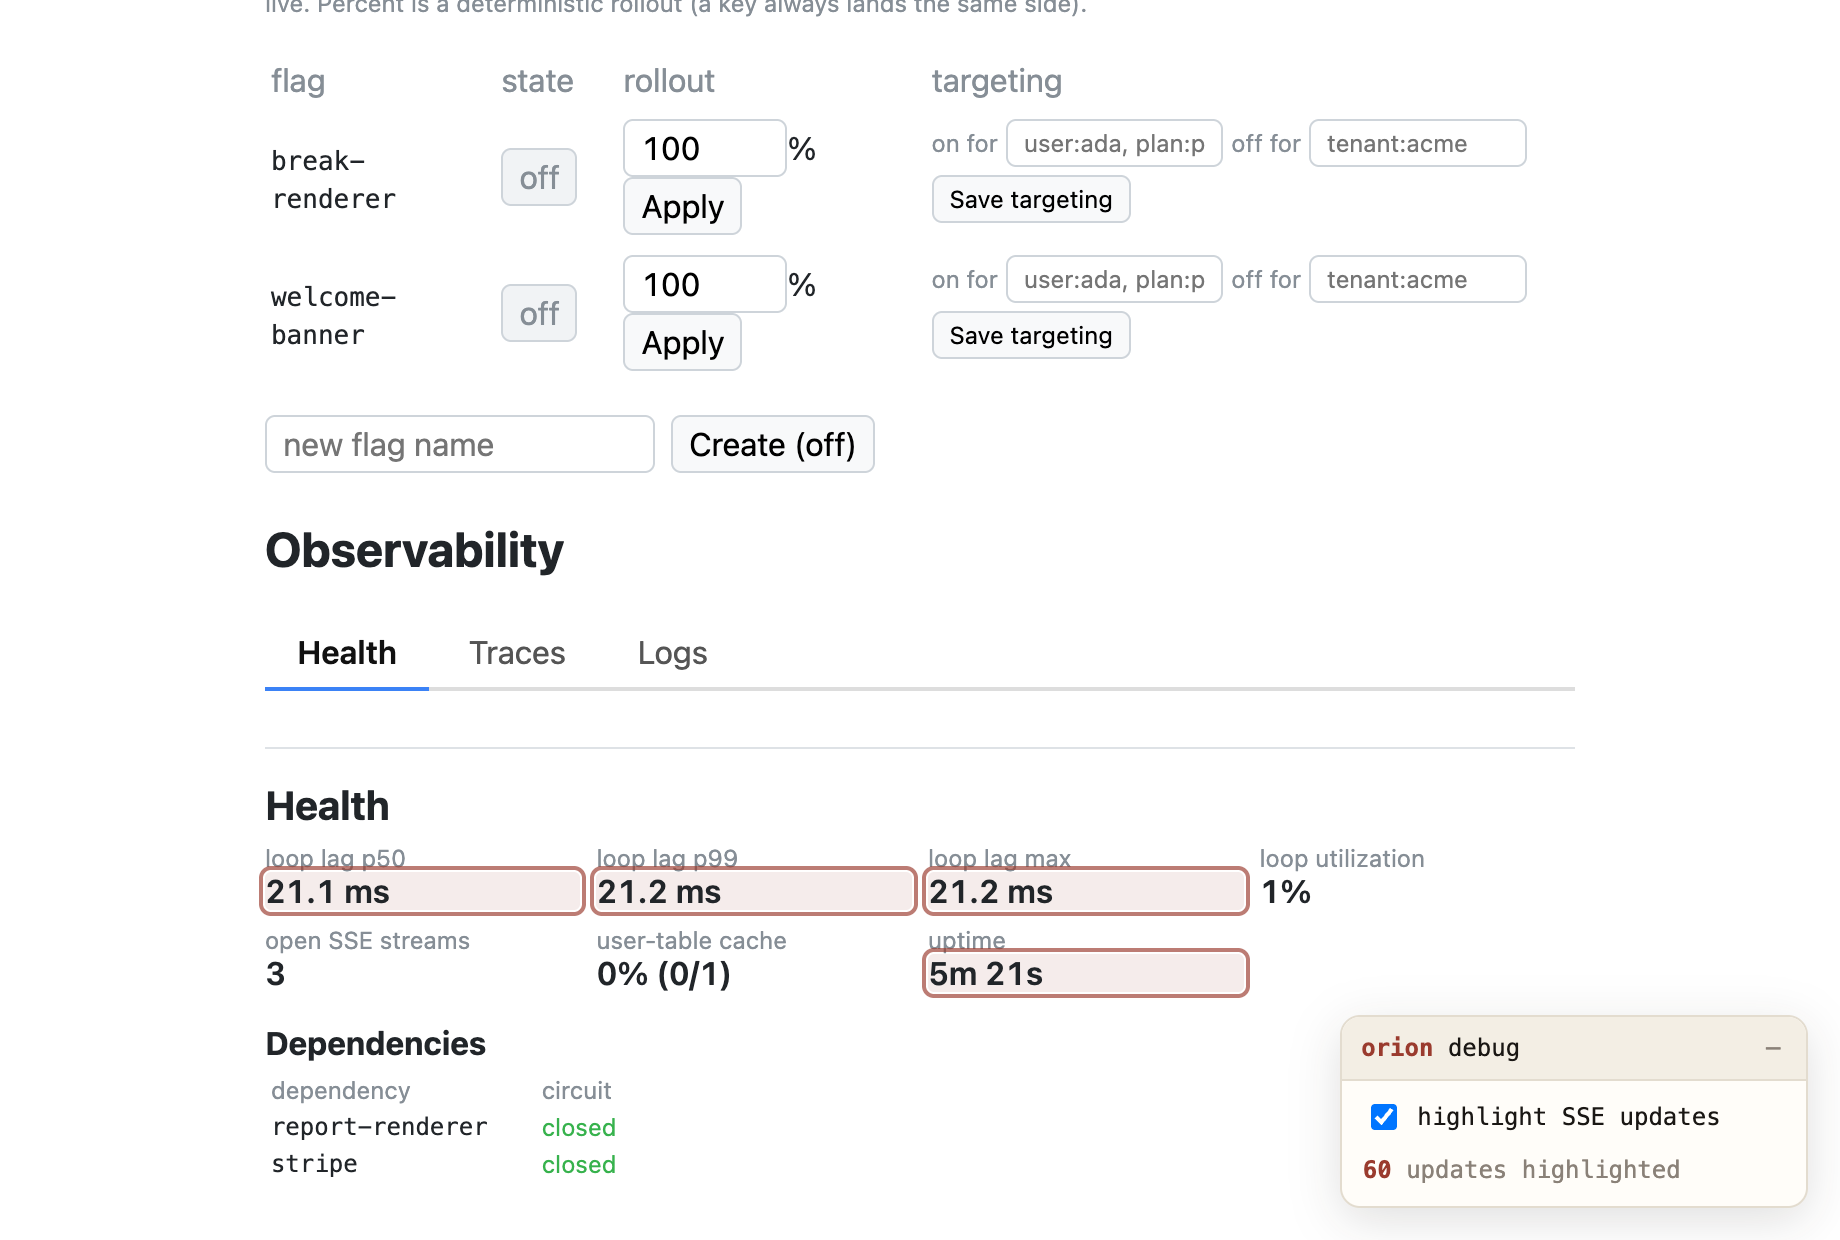
The admin dashboard — three tabs, server-driven
Health, Traces, and Logs sit under one Observability section in the admin dashboard, grouped by a server-driven tabs pattern. The active tab is not a client signal; it's admin session state — held server-side and switched by a command that patches that one admin's container back. Only the open panel is ever in the DOM, and selecting a tab swaps it, aborting the previous panel's SSE stream and opening the new one.
Which tab you're looking at is backend truth, like everything else. It survives a reload. Two admins can have different panels open simultaneously. And the swap is just the one loop — a command writes session state, the live container re-renders, the browser morphs it in.
Event-loop health
Lag percentiles (p50/p99/max), utilization, open SSE streams, render-cache hit rate, uptime — and lag suspects: which route covered the stall window, with count, worst, and last seen.
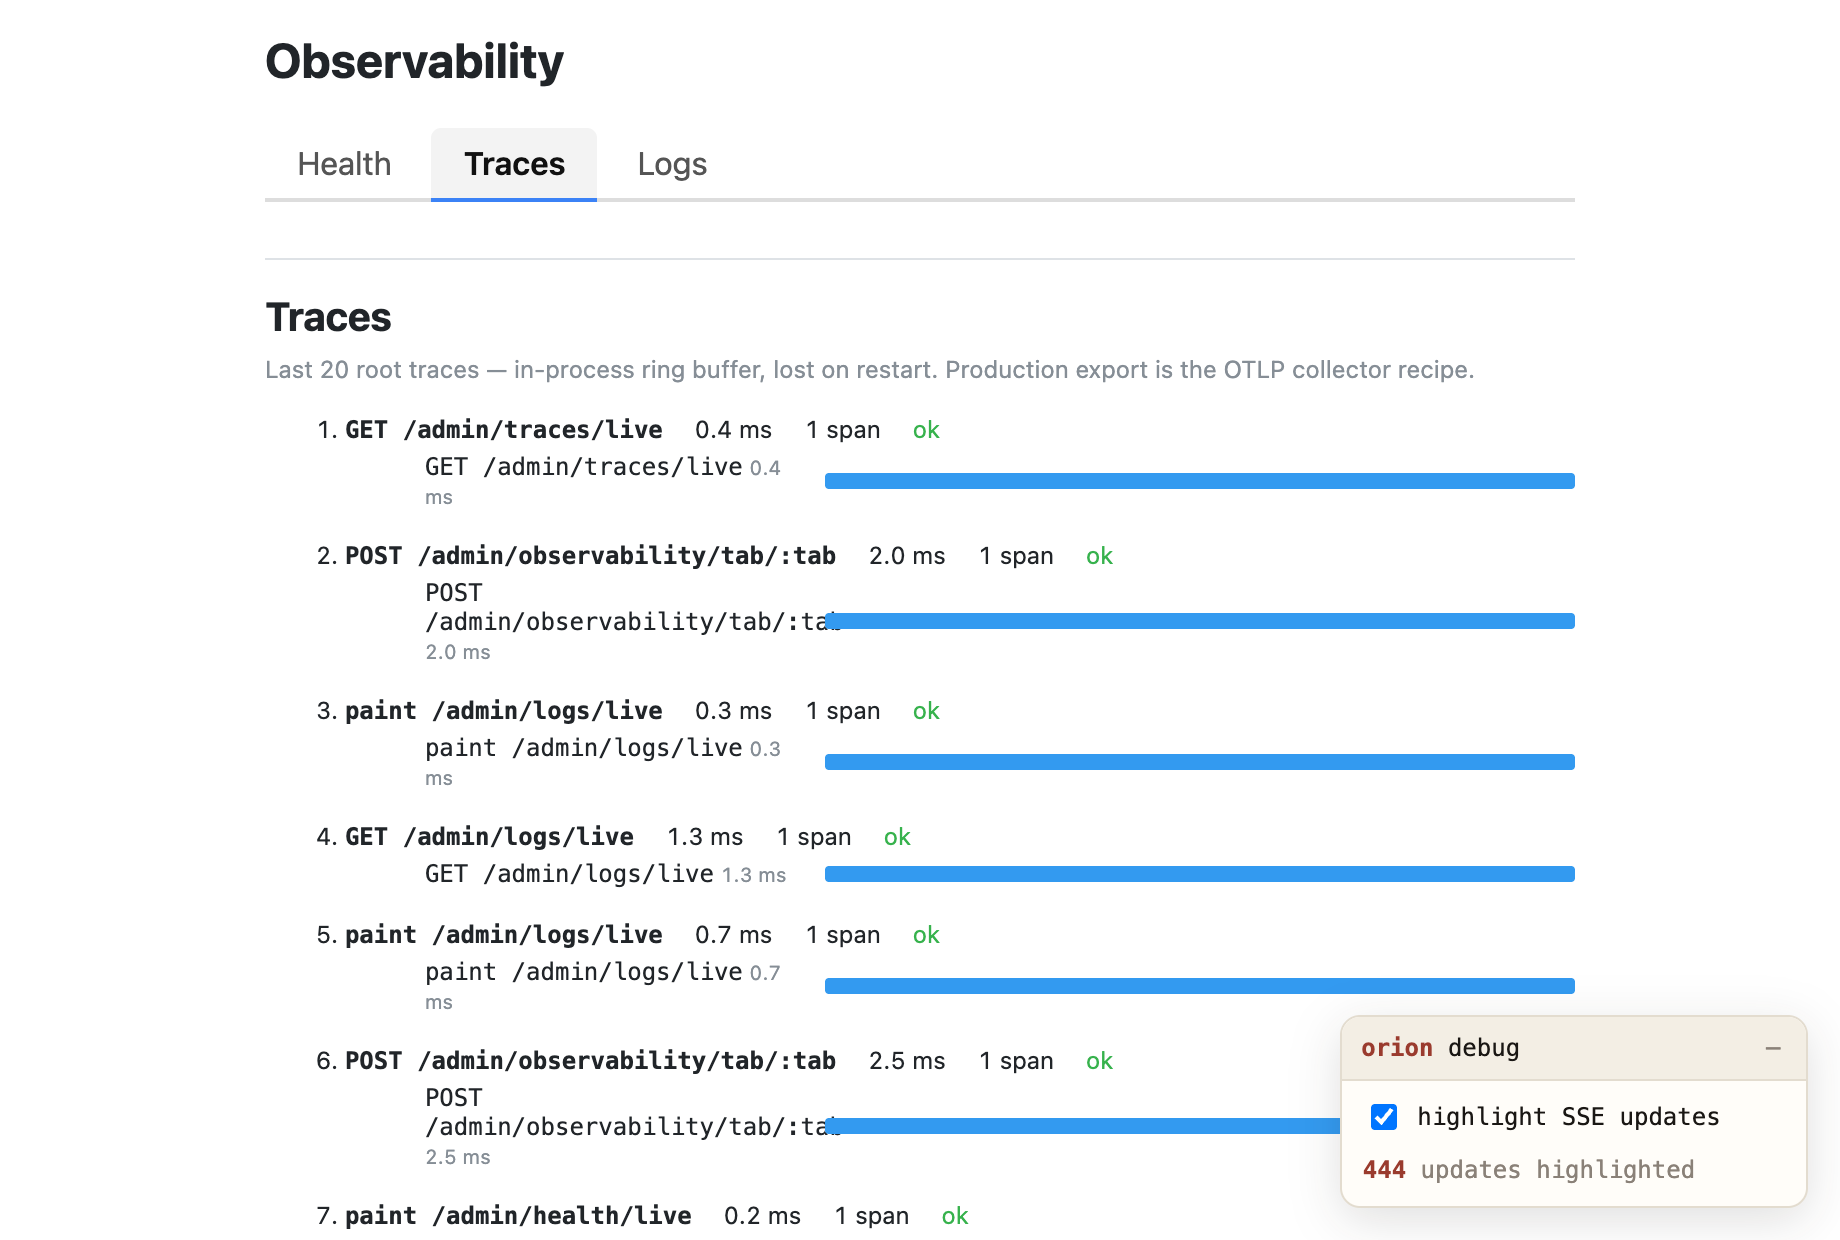
Span waterfall
Recent root traces with per-span waterfall bars. Open it next to a busy feature window and watch requests and paints arrive. The panel's own paints are deliberately untraced — you can't trace the trace viewer, or it would wake itself forever.
Stall attribution
Stalls don't just get detected — they get attributed. A stall is a time window, and the trace buffer already holds hrtime-stamped spans for every request and paint. So the monitor asks: whose span covered the window? Three honesty mechanisms keep the data trustworthy:
- Only a span covering at least half the lag qualifies. A blocked loop runs exactly one task — one span that ran long, never many that ran short.
- GC pauses are attributed to
(garbage collection), not to an innocent route that happened to be finishing when the GC fired. - Stalls with no qualifying span count as
(unattributed). A growing unattributed bucket means "wrap the work you suspect inctx.trace.span()" — attribution is only ever as fine as your spans.
In dev, the dev banner names names: event loop stalled ~480ms — likely:
POST /reports. In prod, it's the canonical log line (which carries the
suspect too) and the admin panel.